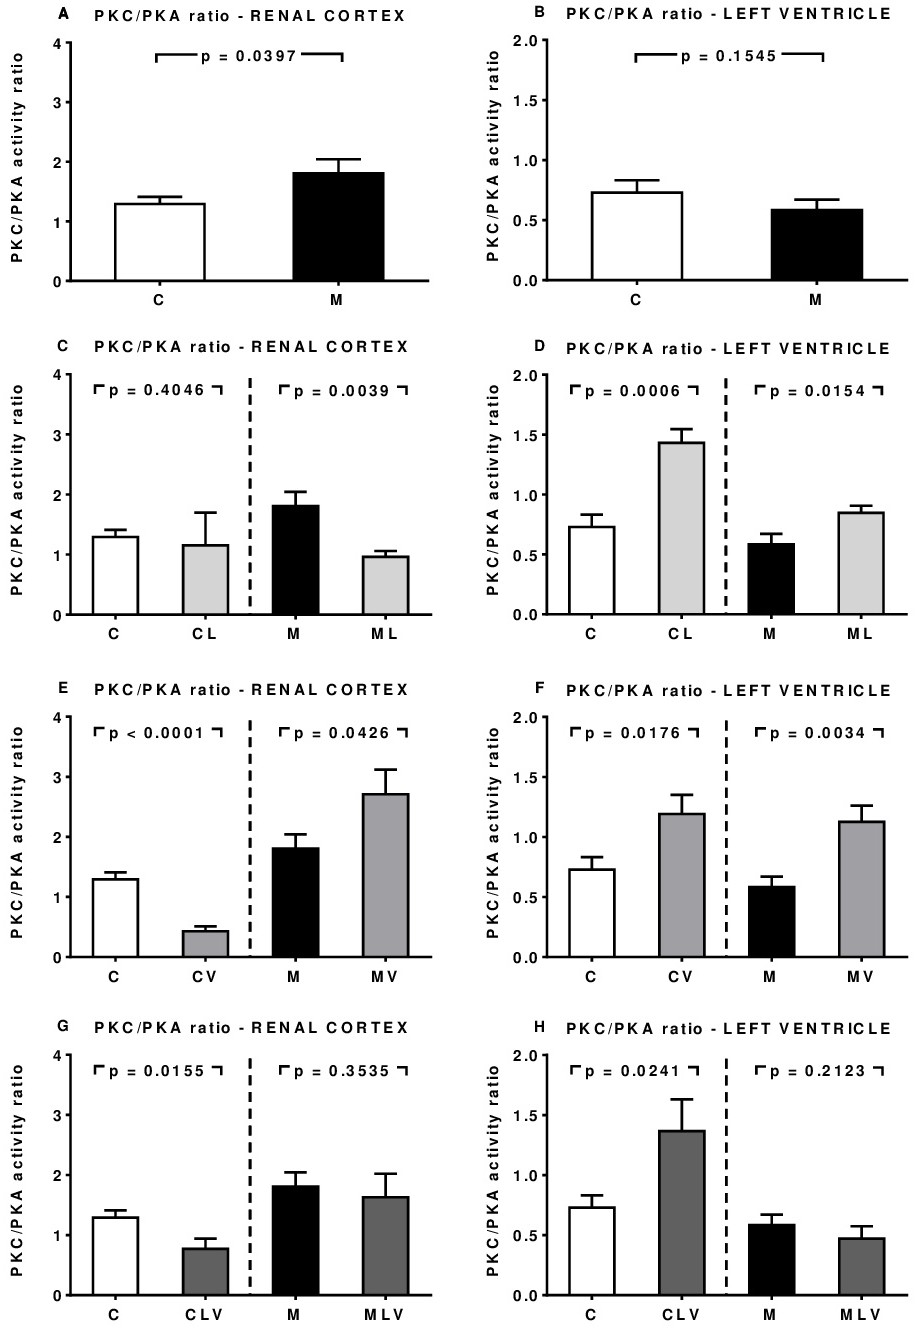
Fig. 4. Different profiles of the PKC/PKA ratio in kidney and heart result from nutritional status and pharmacological treatments with Losartan and Valproate. Groups are those presented in Figs. 2 and 3, as indicated on the abscissae. The ratios were calculated using the same membrane preparation for PKC and PKA assays. Differences between mean values were assessed by Student's t-test. The p values are indicated within the panels.